

Baseline Data Collection
What is an SFD?</p>
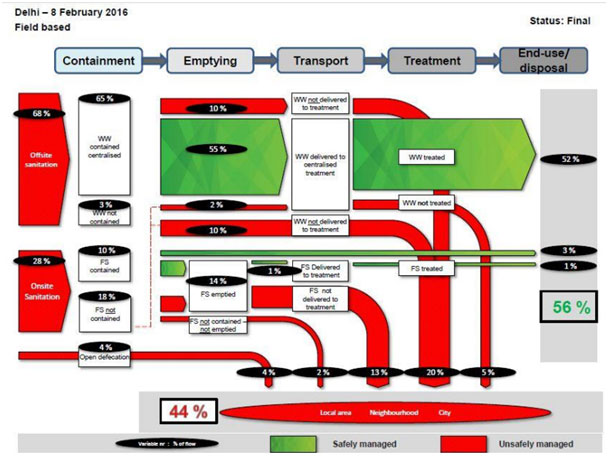
An SFD presents a clear picture of how wastewater and faecal sludge management services are delivered in a city and the resulting challenges; these can then be linked to aspects of service delivery where improvements are needed.
An SFD for any city or town is in three parts:
1. a diagram which shows the pathways all excreta generated by a city's population takes from defecation to final fate - either unsafe discharge to the environment, or safe reuse/disposal;
2. a concise narrative report on the diagram and the service delivery context - including the enabling environment within which the services are being delivered; and
3. a complete record of all the data sources used in developing the diagram and report - the stakeholders consulted, documents reviewed and all validation and quality control exercises implemented.
For more information - http://sfd.susana.org/about/the-sfd
In order to prepare an SFD-
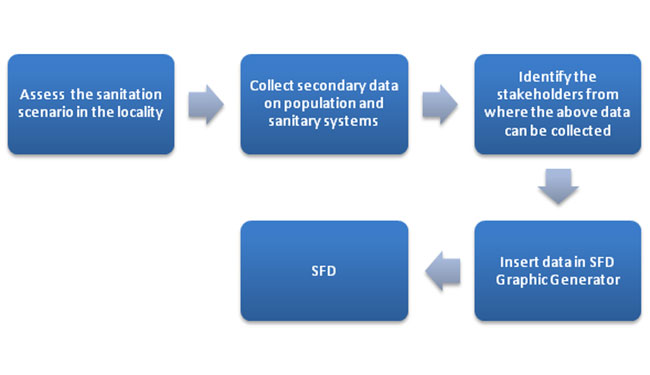
Overview of how to prepare an SFD
Step by Step guide:
The SFD Manual – Volume 1 and 2 – describes the process followed within the SFD Promotion Initiative (SFD PI) for the production of SFD Graphics and Reports, and includes guidance on how to use the SFD Graphic Generator. Volume 1 of this Manual is a guide for the data collection and analysis and should be read in conjunction with the accompanying Volume 2.
| SFD Manual |
This manual provides: - Guidance for data collection and analysis or SFD - Instructions for how to go through the SFD Graphic Generator Template for SFD report/p> Congratulations on making your SFD! Now that you have an SFD, it is necessary to record any key observations/notes in a template report. Save this report for later use in the city sanitation plan. Tool 3.3- Template for SFD Report |
|
|||||||||||||
SFD Graphic Generator Now that we have the required data, we can insert this information in this software to generate an SFD
Tool 3.2- SFD Graphic Generator
1. Use tool 3.2 to produce an SFD Graphic in just three steps.
2. Input the data relevant to your city and, with a couple of clicks, the tool draws an SFD Graphic that you can download for use in reports and publications.
3. The SFD Promotion Initiative developed the tool and if you have any questions please contact the SFD Helpdesk who will be happy to help.

| First CSTF meeting | Second CSTF meeting | Third CSTF meeting | Fourth CSTF meeting |
| Introduction of all CSTF members with attendance being taken | Attendance of all members being recorded | Attendance of all members being recorded | Attendance of all members being recorded |
| Announcement of passing council resolution for CSTF | Presentation of status reports and data gaps (if any) and next steps forward for analysis | Presentation of status Assessment report and next steps forward for analysis | Discussion on technical options and proposed action plan |
| Presentation on CSP and its importance | Media Brief of event with group photo | Discussion on key issues being identified | Review of final CSP report |
| Presentation of steps of preparing CSP | Media Brief of event with group photo | Timelines for finalizing the CSP | |
| Discussion on data required to be collected for status report- Stage 3. | Media Brief of event with group photo | ||
| Media Brief of event with group photo |