
Download the study paper click here
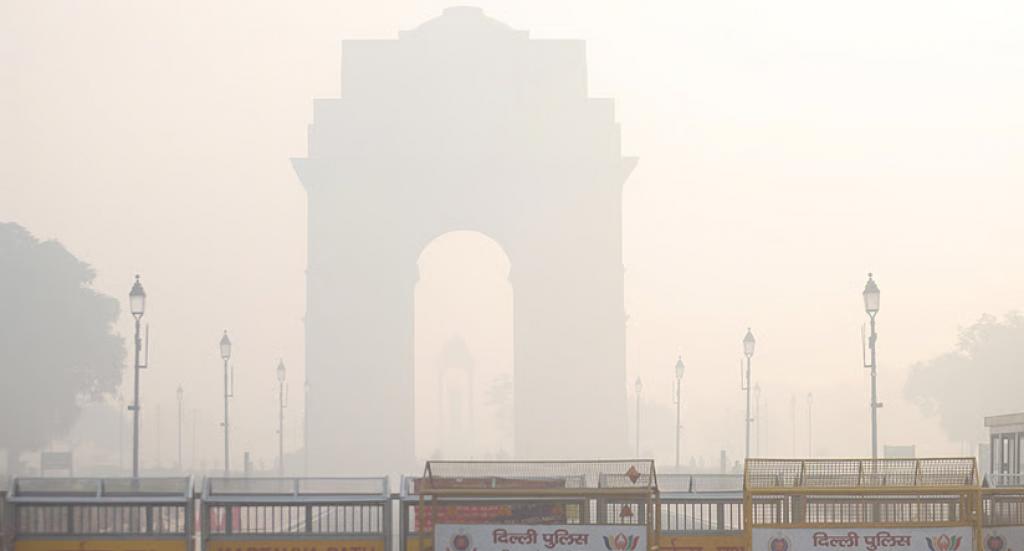
New Delhi, November 11, 2026: A new Centre for Science and Environment (CSE) analysis, released here today, reveals that early winter air pollution (October to mid-November) has worsened in 2026. Emergency traffic curbs, that have been put in place by the government,are not easing the congestion.
"Diwali pollution is an annual tipping point, but elevated particulate levels before the festival this year show that baseline pollution is higher than in previous years," says Anumita Roychowdhury, executive director, Research and Advocacy, CSE. "Year-round emission control across key sources remains inadequate. Had air quality been cleaner leading into winter, and episodic spikes from farm fires and firecrackers kept in check, seasonal weather shifts would not have triggered such severe pollution."
Among local sources, transport remains the largest contributor. While the share of stubble smoke rose during this period, severe pollution episodes continued even when farm fire contributions dropped. Traffic congestion analysis confirms that vehicular emissions heavily drive daily toxic exposure. Furthermore, emergency restrictions barring pre-BS VI vehicles have failed to significantly reduce traffic volumes, Roychowdhury adds.
These trends have emerged from the detailed analysis of air quality data from the portal of the Central Pollution Control Board, the hourly dynamic estimation of contribution of pollution sources by the Indian Institute of Tropical Meteorology, crop fire data from the Indian Agricultural Research Institute, and the traffic data from Tom Tom, the geolocation and mapping technology company that aggregates GPS data to provide real-time and historical road traffic analytics.
Key findings
Early-winter pollution (October to mid-November) worsens in 2026, with a sharper build-up ahead of Diwali: "Delhi’s pre-winter pollution in 2026 was generally higher than in 2025, except for a brief late-September drop caused by rain. In both years, pollution surged in the days leading up to Diwali. However, the overall toxic burden during this pre-festive week was significantly worse in 2026 than in previous years," says Sharanjeet Kaur, deputy programmemanager, Urban Lab, CSE.
The week preceding Diwali recorded an average PM2.5concentration of 236 µg/m³--a three-year high. This marks a 97 per cent increase over the 120 µg/m³ recorded in 2025 and a 32 per cent jump over the 179 µg/m³ seen in 2024, highlighting a significantly steeper pre-festive pollution surge this year.
Delhi's air quality worsens despite declining farm fire contribution: Delhi’s air quality deteriorated sharply in late October, plunging into the 'very poor' category on November 2. The contribution of stubble burning to citywide PM2.5 was a modest 3.9 per cent during GRAP Stage I enforcement; it rose to 11.5 per cent on November 1 (ahead of GRAP Stage II invocation), and eased to 8.6 per cent on November 2.Farm fire smoke peaked at a season high of 16.2 per cent on November 4. Yet by November 6, when GRAP Stage III was triggered, Delhi’s AQI deteriorated to 382 even as stubble smoke fell to around 8 per cent -- proving that severe pollution episodes persist independently of declining farm fires, driven instead by intense local emissions.
Beyond farm fires: Vehicles and regional inflow dominate Delhi's early winter smog
An analysis of the Indian Institute of Tropical Meteorology’s (IITM) Decision Support System (DSS) data for November 1-8, 2026 shows that pollution transported from neighbouring NCR districts accounted for 54.43 per cent of Delhi’s PM2.5, followed by local sources at 33.06 per cent and stubble burning at 14.29 per cent.
Among Delhi’s local pollution sources, vehicular transport was the dominant polluter at 52 per cent, well ahead of residential activities (13 per cent) and Delhi’s peripheral industries (11 per cent). Construction contributed 7 per cent, energy use and waste burning generated 5 per cent each, and road dust and other sectors accounted for 4 per cent each.
These findings underscore that even during peak stubble-burning season, Delhi's toxic air is primarily sustained by regional drift and everyday urban emissions (see Graph 2 in study paper).
Delhi’s original hotspots improve, but emerging hotspots spark fresh concern: Delhi's 13 officially designated pollution hotspots showed improvement during October 1-November 8, 2026, compared to the same period in 2025. Eleven hotspots recorded lower PM2.5 concentrations, led by major drops at AnandVihar (49 per cent), Wazirpur (41 per cent), Ashok Vihar (40 per cent) and Bawana (22 per cent).
Bucking the trend, Jahangirpuri and Punjabi Bagh logged marginal increases of 2 per cent and 1 per cent, respectively, keeping Jahangirpuri the city's most polluted designated hotspot at 163 µg/m³.
Meanwhile, several emerging, non-designated hotspots have begun outpacing older danger zones. VivekVihar (144 µg/m³), Sonia Vihar (139 µg/m³), ITO (137 µg/m³) and DTU (135 µg/m³) recorded intense pollution burdens, while NIH Narela (122 µg/m³) and NSUT Jaffarpur (111 µg/m³) also posted elevated levels. Consequently, areas like VivekVihar and DTU now endure significantly higher PM2.5 loads than several traditional hotspots that saw steep reductions.
NCR-wide pollution build up: Deteriorating air quality extended well beyond Delhi’slocal hotspots to engulf the broader National Capital Region. The dailyPM2.5heatmap reflects relatively low pollution throughout September, followed by a steady climb in October and an aggressive, region-wide spike in early November across Delhi, Gurugram, Faridabad, Noida, Ghaziabad, and Greater Noida.
NO2 -- congestion enhances exposures:Nitrogen dioxide (NO2) trends moved with the congestion (October 30 to November 9). Nearly 80 per cent of NO2is emitted by vehicles and is an appropriate marker for vehicular pollution.NO2 has a first peak at 9 AM; it then falls to its lowest at 2 PM due to improvement in atmospheric conditions even though congestion is high. On an hourly basis in this period, NO2 rose sharply during the evening rush and remained elevated through midnight -- persisting for hours after road traffic had dispersed. Says Kaur: “In effect, the evening rush loads the air and the still night air keeps it there. Daily NO2concentrations surged by one-third starting November 2, 2026, even as traffic congestion remained flat.”
First week traffic changes after GRAP restrictions: Emergency GRAP measures brought negligible relief to Delhi's weekday gridlock, failing to flatten rush-hour peaks or restore normal road conditions. Says Shubham Srivastava, deputy programme manager, clean air and sustainable mobility, CSE: "During the restriction week (November 2-6, 2026), Delhi logged an average daily Travel Time Index (TTI) of 2.40 and an evening peak of 3.49 -- virtually identical to the 2.38 daily and 3.48 peak TTI recorded on Friday, October 30, right before curbs took effect. Commuters still took 13 per cent longer to complete trips compared to standard weekdays from January to April 2026, with evening rush hours taking 13 to 31 per cent longer."
The hourly congestion pattern during the enforcement week mirrored pre-restriction levels: morning peaks were 1 per cent slower, evening peaks stayed flat, and the Planning Time Index (PTI) for evening commutes improved only marginally from 6.36 to 6.16. Across weekdays, congestion ranged from 7 per cent above normal on Friday, November 6 (Dhanteras) to 17 per cent above normal on Tuesday and Wednesday (November 3-4). Rather than clearing the roads, the rules merely prevented the pre-festive rush from worsening.
By contrast, weekends saw traffic drop, though driven only partly by vehicle rules. While Saturday, October 31 (pre-curbs) surged 22 per cent above routine weekend traffic (and 37 per cent in the evening), both weekend days under restrictions fell 8 per cent below baseline. Sunday, November 1, reflected the direct impact of the diesel-truck entry ban with offices shut, while Saturday, November 7 (Chhoti Diwali) saw residents staying indoors or travelling out of the city.
Congestion was tracked using the Travel Time Index [TTI], comparing peak travel times to free-flow night conditions between 2:00 AM and 4:00 AM, and the Planning Time Index [PTI], which reflects the buffer time required for 95 per cent of trips across morning [9:00 AM-12:00 PM] and evening [6:00 PM-9:00 PM] peaks.
Congestion on Diwali vs Holiin 2026: Holi and Diwali cleared Delhi's roads in sharply contrasting ways. During the week before Holi, traffic stayed near or below normal levels, falling to 12 per cent below average two days prior and 23 per cent below normal on the evening before. The only high-traffic day was Saturday -- February 28, 2026 -- which ran 17 per cent above normal. Conversely, the run-up to Diwali saw four consecutive working days running 12 to 21 per cent above baseline congestion. While pre-Diwali travel surges with shopping and gifting trips, pre-Holi travel drops off early.
On the festival day itself, Holi emptied the city far more thoroughly. On March 4, 2026, the Travel Time Index never exceeded 1.25 and averaged 1.15 -- 46 per cent below a normal weekday. Diwali 2026 averaged a higher TTI of 1.32, sitting 29 per cent below a typical Sunday across the benchmarked hours, and saw an afternoon congestion plateau around 1.5. This divergence reflects different holiday routines: people spend Holi mornings celebrating at home, whereas Diwali afternoons still see last-minute shopping and social visits. By the day after each festival, travel patterns converged, with congestion settling 26 to 28 per cent below a standard day across all three comparative festival instances.
The way forward
Says Roychowdhury: “While episodic spikes from Diwali firecrackers and farm fires visibly trigger early-winter smog, Delhi-NCR’s severe pollution crisis is rooted in weak round-the-year mitigation across all major sectors and the region. The rapid proliferation of new pollution hotspots and the aggressive build-up across NCR confirm that baseline emissions remain unsustainably high long before adverse winter weather sets in.”
CSE researchers point out that because routine baseline controls have faltered, the region is forced into an escalating dependence on emergency GRAP curbs rather than reducing reliance on crisis-mode restrictions. “Short-term emergency steps cannot substitute for systemic solutions,” says Roychowdhury. Cleaning the region's air permanently demands deep, continuous, year-round emission cuts targeted at vehicular transport, industries, construction activity, waste burning and dispersed urban sources across the entire airshed.
Traffic gridlock,at the same time, is a pollution multiplier, yet current clean air action plans treat vehicular emissions primarily as a tailpipe technology or routing problem rather than an absolute volume crisis. Srivastava says, “During idling and slow crawlvehicles run at inefficient engine speeds, increasing emissions per kilometre travelled.Conventional traffic engineering and piecemeal emergency restrictions cannot absorb this overload; effective pollution control requires strategies that actively scale down vehicular volume on the streets through mass public transit, mandatory trip-reduction mandates, and stringent car-restraint measures.”
For more information, interviews etc, please contact Sukanya Nair of The CSE Media Resource Centre: 8816818864, sukanya.nair@cseindia.org
Share this article