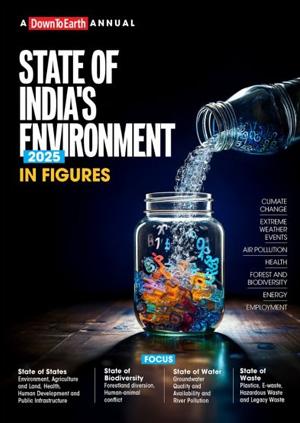
Data and statistics point to difficult times ahead for the nation: says CSE’s State of India’s Environment in Figuresreport
- Annual e-compendium of data and numbers on environment and development released on the eve of World Environment Day
- Ranks states and Union territories on the basis of their performance in four thematic areas: environment, agriculture, public health, and human development and public infrastructure. Andhra Pradesh, Sikkim and Goa bag the top spots
- Uses the government’s own data to show that even top-ranked states and UTs are struggling in critical areas. No state or UT excels across all four themes
Order your copy of the e-report click here
New Delhi, June 4, 2025: As they do every year,Centre for Science and Environment (CSE) and Down To Earth magazine have once again marked the World Environment Day by releasing their analysis of year-long data and statistics on environment and development in India here today – and the numbers paint a grim picture.
Releasing the analysis in the form of an e-compendium of data and statistics titled State of India’s Environment in Figures 2025, CSE director general SunitaNarain said: “Numbers usually give us the truth, and what we are unveiling on this eve of this year’s World Environment Day – based on data that the government itself has generated and which is available publicly -- clearly indicates that this is not the time for complacency, nor for chest-thumping.”
She added: “Take just one indicator. India’s most populous states – Uttar Pradesh, Maharashtra, Bihar, West Bengal and Madhya Pradesh – that are together home to 49 per cent of the country’s population, rank low on the themes that our analysis has focused on. This means large segments of the country’s population remain vulnerable and exposed to multiple threats.”
Speaking at the launch, Richard Mahapatra, managing editor of Down To Earth, said: “This is the 10th year of publication of this seminal analysis and data compendium from CSE and Down To Earth. We have used 48 indicators clubbed under 12 sub-categories to assess all the 36 states and UTs. Though data gaps remain a major concern, the report is important because it joins the dots and interprets whatever data is available and existing to make a factual statement on environment and development.”
Mahapatra adds: “Besides this, the report also brings out the key trends, such as the occurrence of extreme weather events and declining landholdings in agriculture.”
State of the states: Andhra Pradesh, Sikkim and Goa bag the top spots
None of the states are emerging as complete winners, says Mahapatra. Andhra Pradesh tops the rankings in the ‘environment’ category, having excelled in managing its forests and biodiversity and for its efforts to contain the impacts of climate change. “However,” Mahapatra points out, “it continues to struggle with its sewage treatment and management of polluted river stretches.”
In ‘agriculture’, Sikkim scores the highest with its strong performance in agricultural inputs and sustainable land-use practices; but it lags behind in farmer welfare and agricultural economy.
Goa is at the top spot in the thematic areas of both ‘public health’ and ‘human development and public infrastructure’. It is the only state – says the CSE report – where all registered deaths are medically certified with a known cause of death. At the same time, Goa has a shortage of hospital beds per 1,000 people, and also lags behind in per capita power availability and the number of women in its labour force.
State of climate change and extreme weather: Dire prognosis
2024 was the warmest year on record for India; it was also the period in which 25 states recorded their monthly highest 24-hour rainfall in the last 123 years.
Presenting the CSE-Down To Earth analysis, RajitSengupta, associate editor of the magazine and one of the authors of the study report, said: “Extreme weather events occurred on 88 per cent of the days in 2024, marking a sharp rise in both frequency and impact since 2022. Natural disasters induced by extreme weather and other reasons emerged as the primary drivers of internal displacement.”
India recorded 5.4 million internal displacements across at least 27 states and UTs in 2024, with Assam alone accounting for nearly half of them. This was the largest internal displacementin volume due to weather and geophysical disasterssince 2013. In terms of disaster types, floods accounted for 64 per cent of the displacement.
The country’s greenhouse gas (GHG) emissions had declined in 2020 for the first time since 2011, largely due to the COVID-19 pandemic. In 2023, India accounted for 7.8 per cent of global GHG emissions -- the highest level since 1970. In 1980, the country’s contribution had stood at just 3.3 per cent: its share has since risen by roughly 1 percentage point each decade. Sengupta points out that this growth has accelerated in recent years: between 2020 and 2023 alone, India’s share increased by 0.84 percentage points.
All signs point to a future that will continue to be severely taxed by changing climate. The first quarter of 2025 stands out as one of the wettest starts to a year in recent memory. Compared to the same period in the past three years (2022–24), India witnessed an alarming spike in heavy rains, floods and landslides, reported on 80 out of 90 days. The toll has been significant: 122 lives lost -- the second-highest after 2023 -- and 24,807 ha of cropped area affected.
State of energy, agriculture and forests: Hits and misses
Despite comprising 36 per cent of the installed capacity, new renewable sources (solar, wind, bio-power and small hydro) currently generate only 14 per cent of our total electricity–Sengupta says that this points to severe under-utilisation of capacity.
Rajasthan, Gujarat and Tamil Nadu lead in adapting new renewable sources,which account for over 20 per cent of the power generation in these states.
The analysis report notes that population growth, rapid urbanisation and industrialisation have led to a steady decline in the share of agricultural land in India: from 62.33 per cent in 1952-53 to 58.69 per cent in 2022-23.This shift has contributed to unsustainable farming practices, including an over-reliance on groundwater and the cultivation of water-intensive crops in regions where they are ill-suited.
Tubewell irrigation has surged dramatically -- from just 0.55 per cent in 1960-61 to 43.34 per cent in 2022-23 -- with over half of the irrigated land in Punjab and nine other states now dependent almost completely on tubewells.
India added 16,630 sq km of forest cover between 2013 and 2023, but 97 per cent of this increase was outside officially recorded forests.At the same time, the country approved the diversion of 29,000 hectare of forestland in 2023-24, the highest since 2014-15. Five states including Jharkhand and Uttar Pradesh, recorded decade-high diversions.
Says Kiran Pandey, programme director of CSE’s Environmental Resources unit and an author of the report: “These diversions, which disrupt wildlife corridors, are one of the factors behind increasing incidences of human-animal conflicts in the country. In 2023-24, human deaths due to elephant attacks rose by 36 per cent compared to 2020-23. Tiger attacks caused 82 human deaths during this period, marking the second highest toll since 2020.”
State of air pollution and public health: Lower life expectancy, higher costs
Since 2021, residents of 13 Indian capital cities, including Delhi, have faced polluted airon at least one out of every three days, says the report.The impact is severe, with 18 of 28 state capitals experiencing greater life expectancy loss from air pollution than their state averages. For instance, in Lucknow, the average life expectancy loss has been six years and five months – this is six months more than Uttar Pradesh’s state average of five years and 11 months.
In 2022, the average life expectancy of an Indian was estimated to have shortened by three years and six months due to air pollution. The National Capital Territory of Delhi faces the worst scenario: its population losesseven years and nine months of life expectancy.
In terms of public health, the report notes that nearly five years after the pandemic began, its impact still lingers in the country. Government data estimates 3.06 million excess deaths in 2020 and 2021 -- over six times the official COVID-19 toll.
India continues to grapple with weak health infrastructure, needing 36 per cent more Community Health Centres, which face an 80 per cent shortfall in specialist doctors. Out-of-pocket healthcare spending (direct payment for healthcare by individuals which may or may not be reimbursed) rose 24 per cent to Rs2,600 per person in 2021-22, making up 45.1 per cent of health costs – thus surpassing government spending and highlighting the heavy financial burden on individuals.
Residents in five out of 21 states spent more than 50 per cent of their total health expenditure from their own pockets in 2021-22. Uttar Pradesh recorded the highest share, with out-of-pocket payments accounting for 63.7 per cent of the per capita total health expenditure. Kerala and West Bengal also showed significant reliance on out-of-pocket spending, at 59.1 per cent and 58.3 per cent, respectively.
State of water and waste: Twin trauma
Pandey says that “water quality remains a major concern across both surface and groundwater sources. This is compounded by significant data gaps in monitoring, making accurate assessments difficult.” For instance, in 2022, India monitored only 37 per cent of its river quality stations -- and nearly half of these detected toxic heavy metals at hazardous levels.
While India’s overall reliance on groundwater increased slightly in 2024, some 16 states and UTs face critical over-extraction. As a result, districts where groundwater is available at depths of over 40 m rose from 75 in 2014 to 135 in 2024.
In waste management, with just 18 months left to meet its 2026 target, India has remediated only half of its legacy waste.Meanwhile, generation of most other kinds of waste has jumped up. E-waste generation surged by 147 per cent in seven years, rising from 0.7 million tonne(MT) in 2017-18 to 1.75 MT in 2023-24. Hazardous waste generating industries have had a 25 per cent rise since 2017-18, pushing waste generation up by 66 per cent to 15.66 MT.Plastic waste had reached a record 4.14 MT in 2022-23, despite the ban on certain single-use plastics. Fifteen states and UTs saw plastic waste generation increase by more than 50 per cent between 2018-19 and 2022-23.
State of employment: A ferment in the making
The report indicates that India’s workforce is facing a rapidly deepening economic stress. Between 2017-18 and 2022-23, incomes for both salaried and self-employed workers have declined when adjusted for inflation.
Over 73 per cent of India’s workers are in the informal sector, where job security is rare. More than half of the country’s regular employees lack basic social security like contracts, paid leave, or pensions.
Gender disparities persist in the work force: while 60.8 per cent of men work nearly eight hours daily, only 20.7 per cent of women are engaged in employment, and even then, for fewer hours.
Says Narain: “The report does not discount the enormous strides that India has made in many fields. What it essentially does is hold up a mirror and make us acquainted with the fact that we need to sit back and take note of the trends, make sense of them, and initiate corrective actions. As we step into June 5, the State of India’s Environment in Figures reminds us that there is work to be done.”
In her closing remarks, Narain made a strong case for data: “We have to understand our world as it is changing. We have to see what others are doing and what is working and what is not. We do not deny the problem and its scale, but we must also applaud the good work that is happening and what it can tell us. And to do that, data is critical. Data is not about the problem – it is about the solution. Unless we have clear, credible data, there can be no solutions or policies. Our strong plea therefore is that we need more – not less – data.”
If you have questions or need more details, please contact Sukanya Nair of The CSE Media Resource Centre: sukanya.nair@cseindia.org, 8816818864.

Share this article