Odd-and-even 2.0 worked but farm fires and forest fires played spoilsport, says CSE
Takes on motivated and half-baked science
- Lambasts claims of half-baked science which says odd-and-even has not worked and therefore, vehicles are not the problem
- CSE analysis of odd-and-even scheme shows air pollution dropped during first 10 days of the scheme but suddenly increased April 23 onwards
- Investigations based on NASA satellite pictures show sudden rise in crop burning across Punjab and Haryana after April 21. Pollution increased because of this. Forest fires in Uttarakhand added to the pollution load
- CSE investigation triggered by widespread media reports on studies like that of India Spend that claimed air pollution had increased during odd-and-even 2.0
- Poor air quality analysis can lead to irresponsible interpretation by industry. This lack of clarity has made it a convenient narrative for the auto industry to claim in the Supreme Court that vehicles do not contribute to pollution
New Delhi, May 3, 2016: Centre for Science and Environment (CSE) has released its analysis of air quality data during the second phase of odd and even scheme – from April 15 to April 30. This shows that air pollution took a downward dip during the first 10 days of the scheme but registers a sudden spike from April 22 onwards.
Further investigations and analysis of NASA satellite pictures has exposed massive crop fires in Punjab and Haryana that started around April 19 – which could be the reason behind the rise in pollution levels.
The CSE investigation was triggered by the widespread media reportage on the findings of India Spend that PM2.5 had increased by 23 per cent and PM10 by 22 per cent compared to the previous fortnight. This was also used by the automobile industry in the Supreme Court hearing on April 30, 2016 to claim that this shows that vehicles are insignificant contributors to pollution and therefore do not merit stringent action.
The CSE investigation has exposed how half-baked and irresponsible explanation of the air quality trend has led to misinterpretation of the benefit of the odd-and-even scheme and helped create the industry myth that vehicles are not the problem. India Spend and the industry have failed to catch the reason for the sudden spike in pollution post-April 22. They have missed the massive crop fires that started around April 20 and got intense over time and elevated pollution not only in Delhi, but in other cities of northern India as well.
What is damaging is that in the absence of clear explanation of the reasons for the pollution spike towards the end of the scheme, this has led to the misleading conclusion that odd-and-even has not made any impact.
What has CSE found?
Pollution level declined during the initial phase of odd-and-even for the first nine days: Between April 15 and April 23 PM2.5 levels declined substantially compared to the previous fortnight. The average PM2.5 level during the first nine days was 24 per cent lower than the average of the previous fortnight.
PM2.5 and NO2 suddenly spiked post-April 23 and continued till April 30: There is a distinct and sudden spike of pollution after April 23 when PM2.5 increased by as much as 92 per cent and NO2 by 47 per cent. In fact, air quality index reported for the key north Indian cities including Delhi, Faridabad, Agra and Lucknow shows an overall increase in PM2.5 after April 26. Within a day, the AQI worsened by 22 to 20 per cent by April 26. The AQI of Delhi worsened by 16 per cent.
CSE investigated the reason for the sudden pollution spike and found raging crop fires after April 21: This sudden spike in pollution after April 23 had to have a reason -- CSE therefore investigated based on NASA satellite imagery (NASA web fire mapper) and found that before the odd-and-even scheme and during the first few days, there was virtually no crop fire in Punjab and Haryana. But April 21 onwards, there was a sudden spurt in crop fires that became widespread and intense from April 23 onwards. April 26 was particularly bad. During the spike, the pollution levels increased despite the increase in wind speed (see Graph and satellite maps – check the URL given below).
CSE concludes that odd-and-even is an important temporary emergency measure to help control worsening of pollution. But this will have to be implemented along with longer term solutions for lasting air quality gains.
- For the graphs and satellite maps, please visit
- For any other details or to set up interviews, please contact Souparno Banerjee, souparno@cseindia.org, 9910864339.
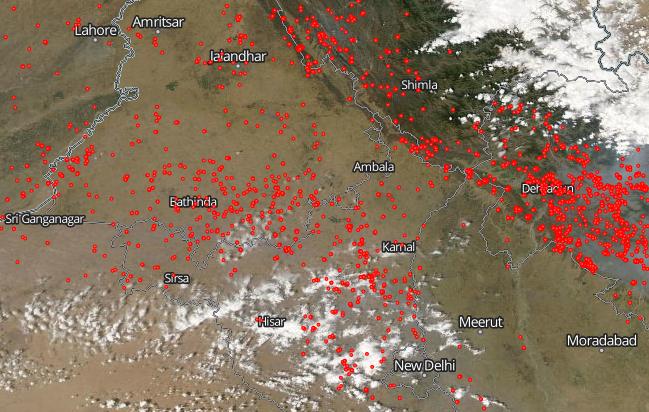
Figures: NASA Satellite Images showing open crop burning in Punjab, Haryana (From April 1 – 30, 2016

Graph 1: PM 2.5 levels before and during second odd and even scheme (April 1 –30, 2016)

| Satellite Image |
| Satellite Image taken on 26th April 2016 of Punjab fires |
 |
Share this article